A useful view of your day.
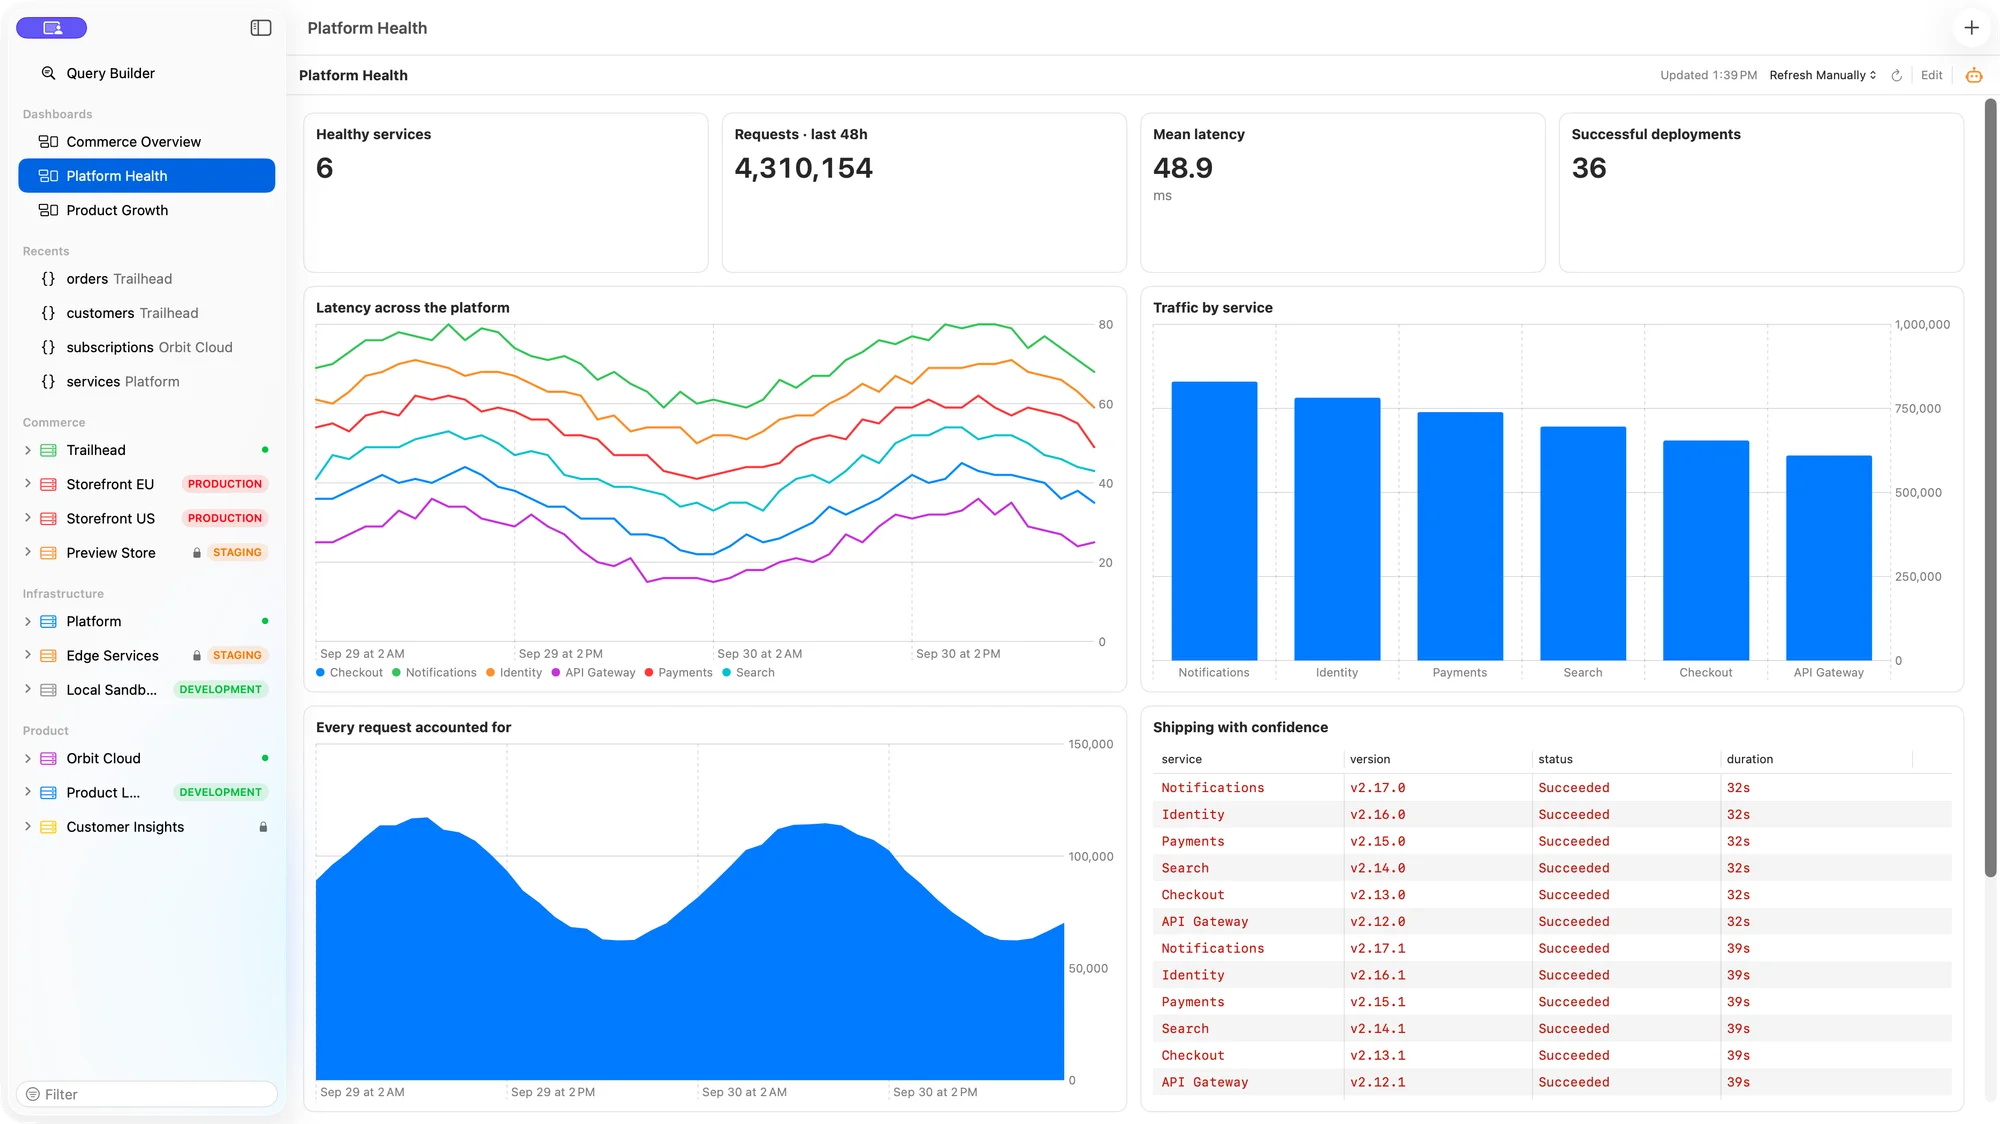
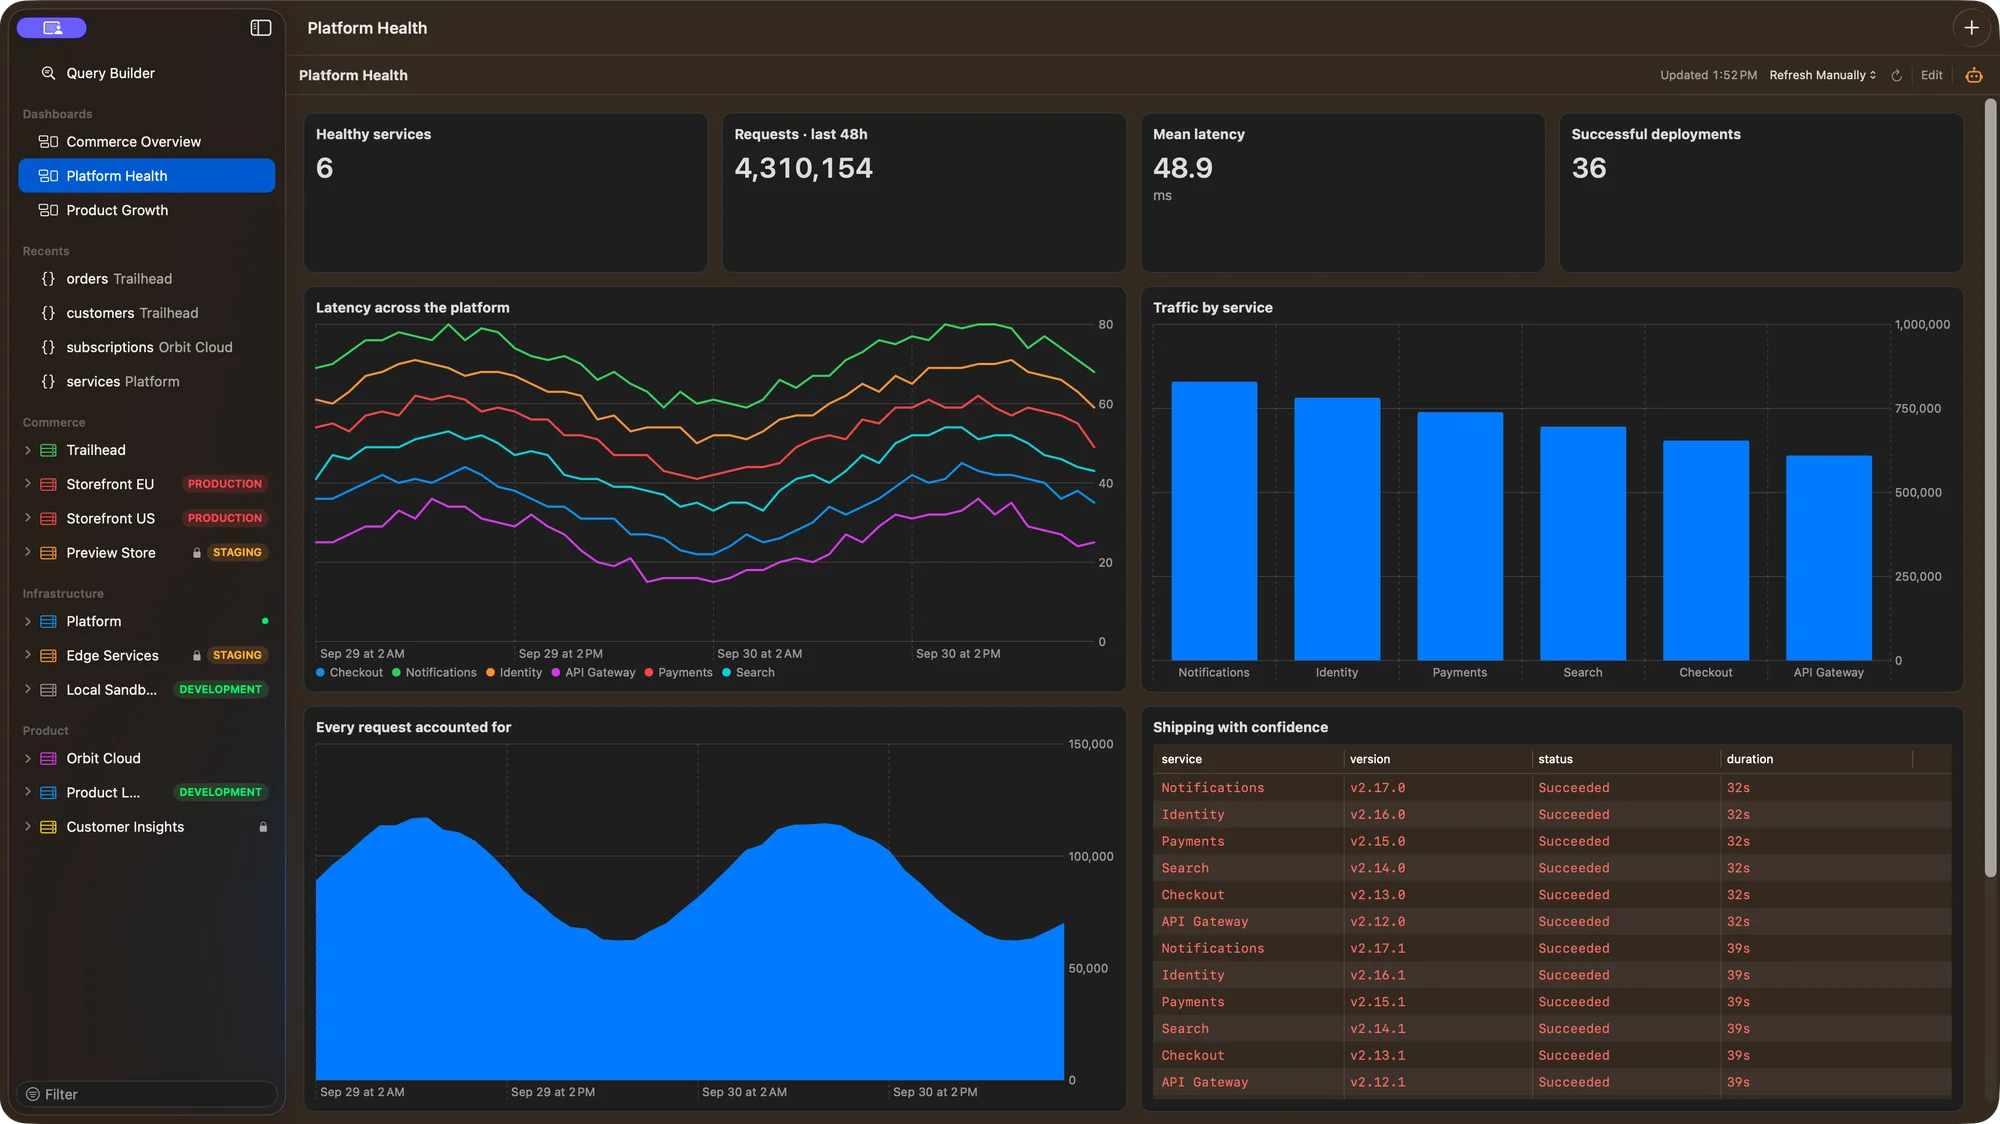
Mix charts, number widgets, tables, and notes. Group dates, split a series, and filter to the slice of data that matters.
Dashboards
Put revenue, product activity, or service health in one view. Build widgets from fields or write the query yourself, then share the dashboard as a readable JSON file.
Take a closer look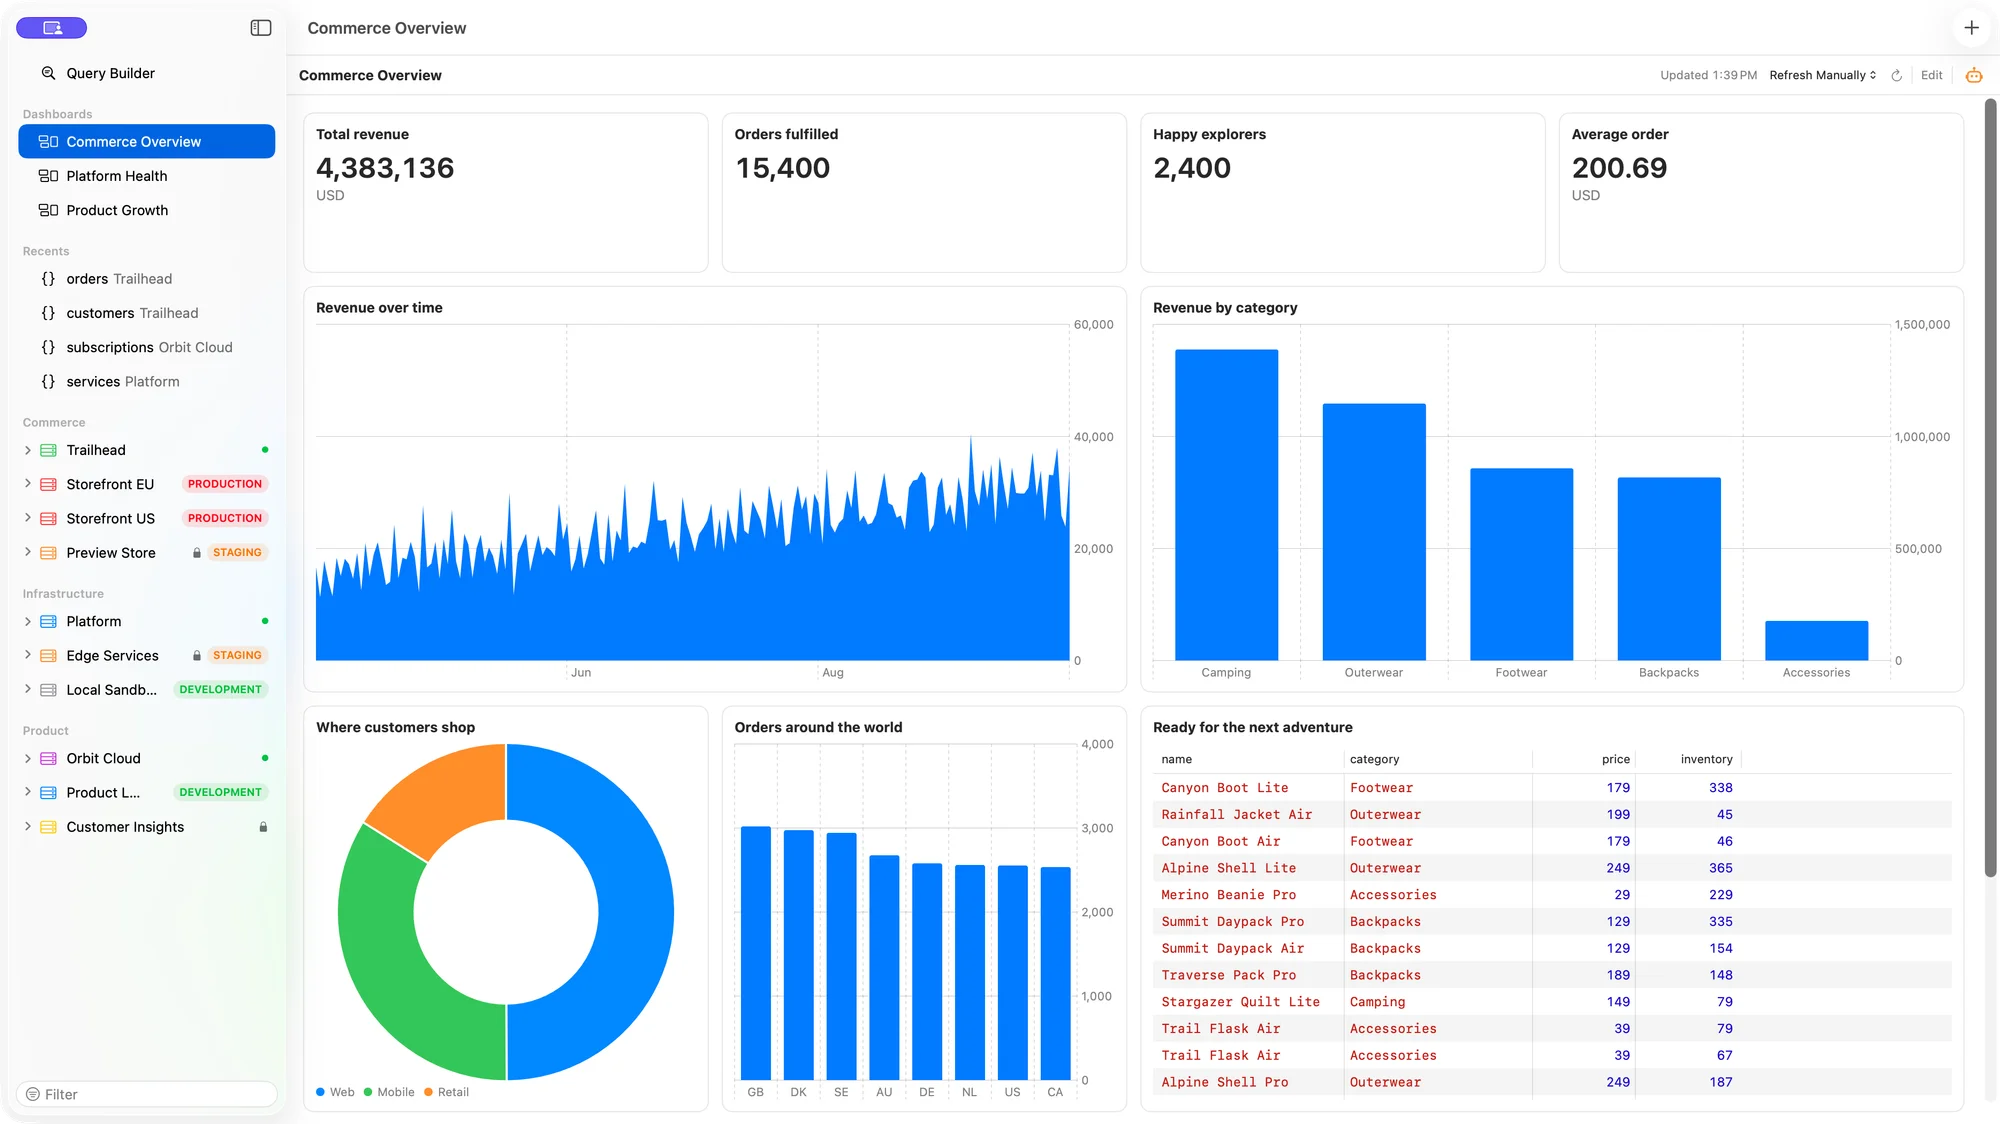
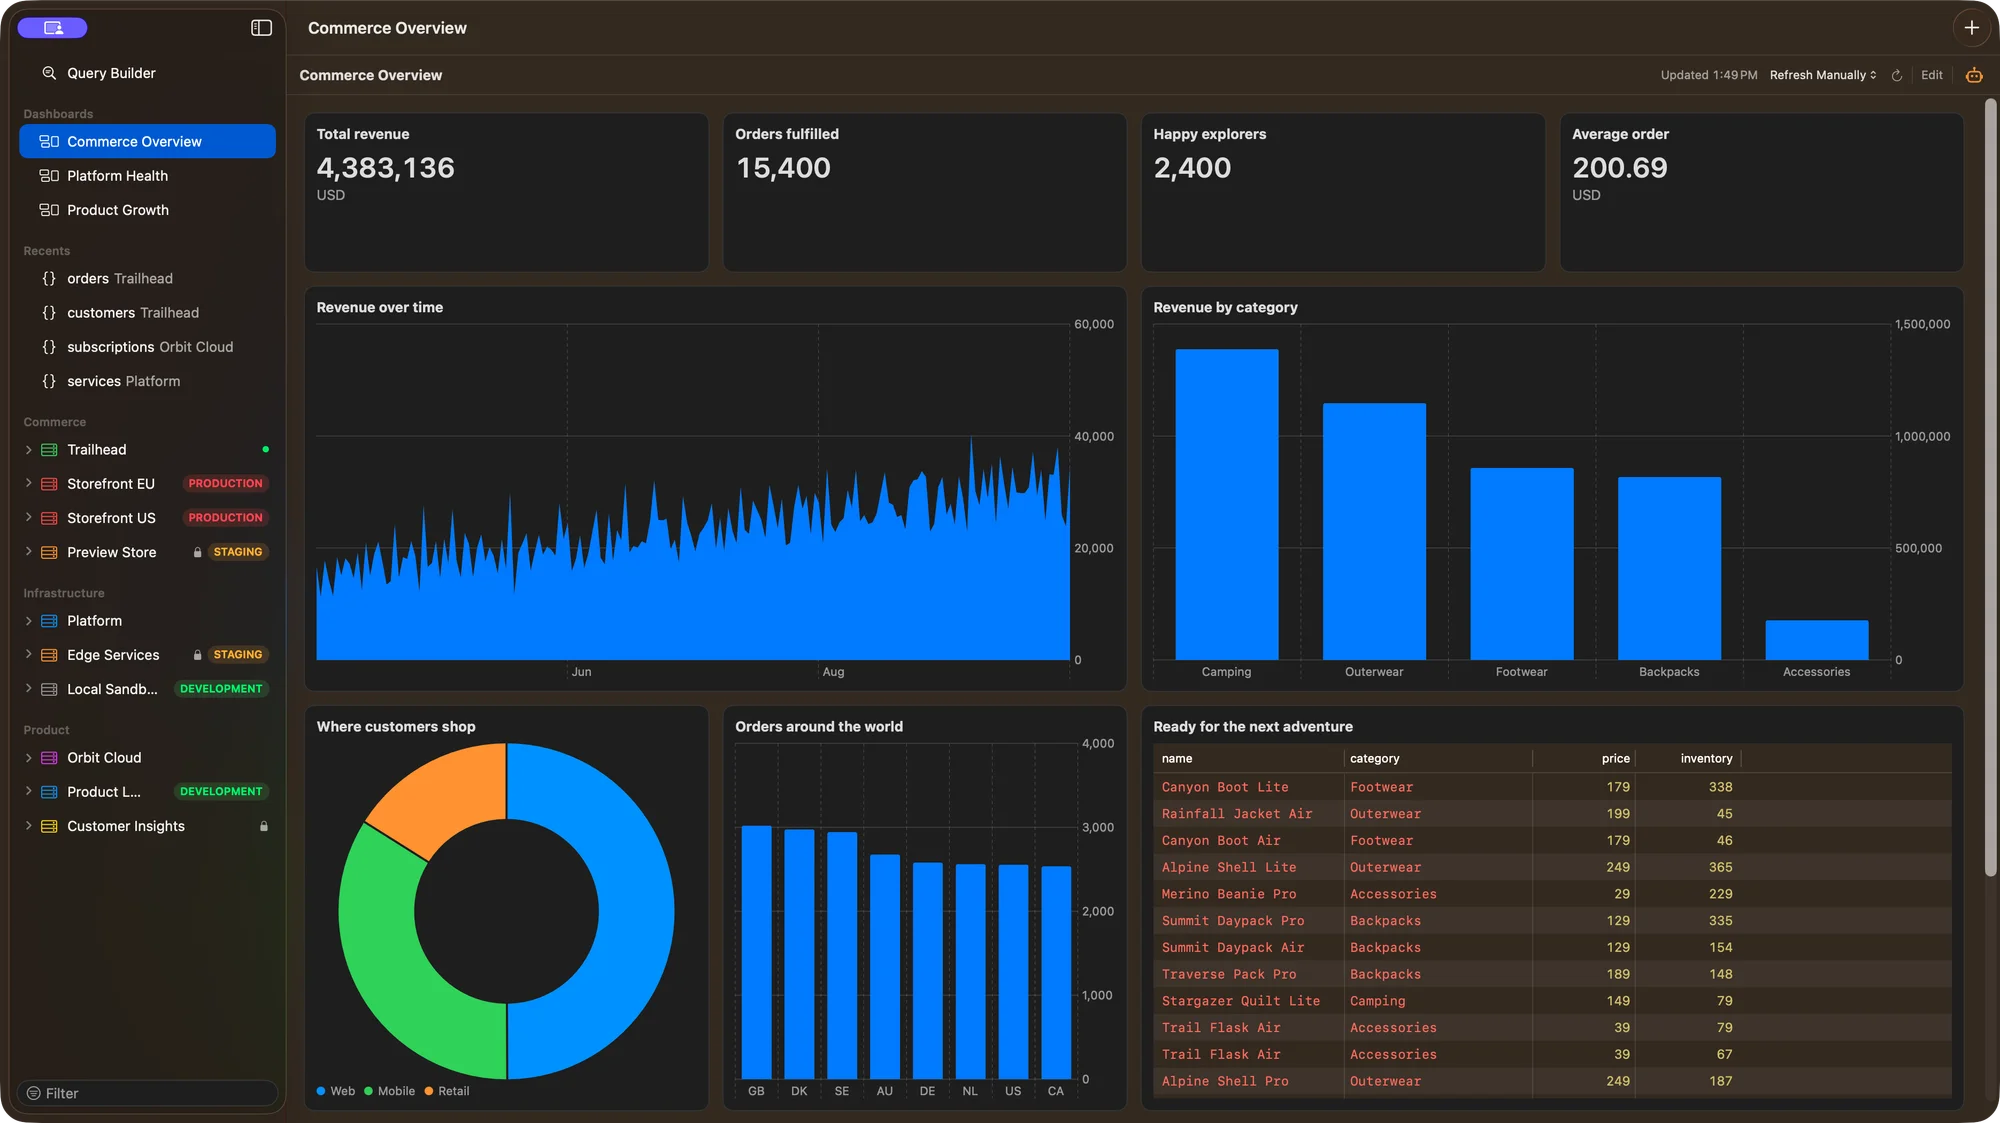
Mix charts, number widgets, tables, and notes. Group dates, split a series, and filter to the slice of data that matters.
Choose fields and chart channels in the widget builder, check the live preview, and inspect the generated pipeline.
Dashboards live in .dashboard.json files. Share them in Git; each Mac maps connection aliases to its own saved connections.
From first click to useful work
Choose the database and collection behind a metric, a trend, or an operational overview.
Select a chart type, map fields, add filters, and adjust the size in the dashboard grid.
Refresh on demand or at an interval. Put the dashboard file in your team’s shared repository.
Different questions. Your own view.
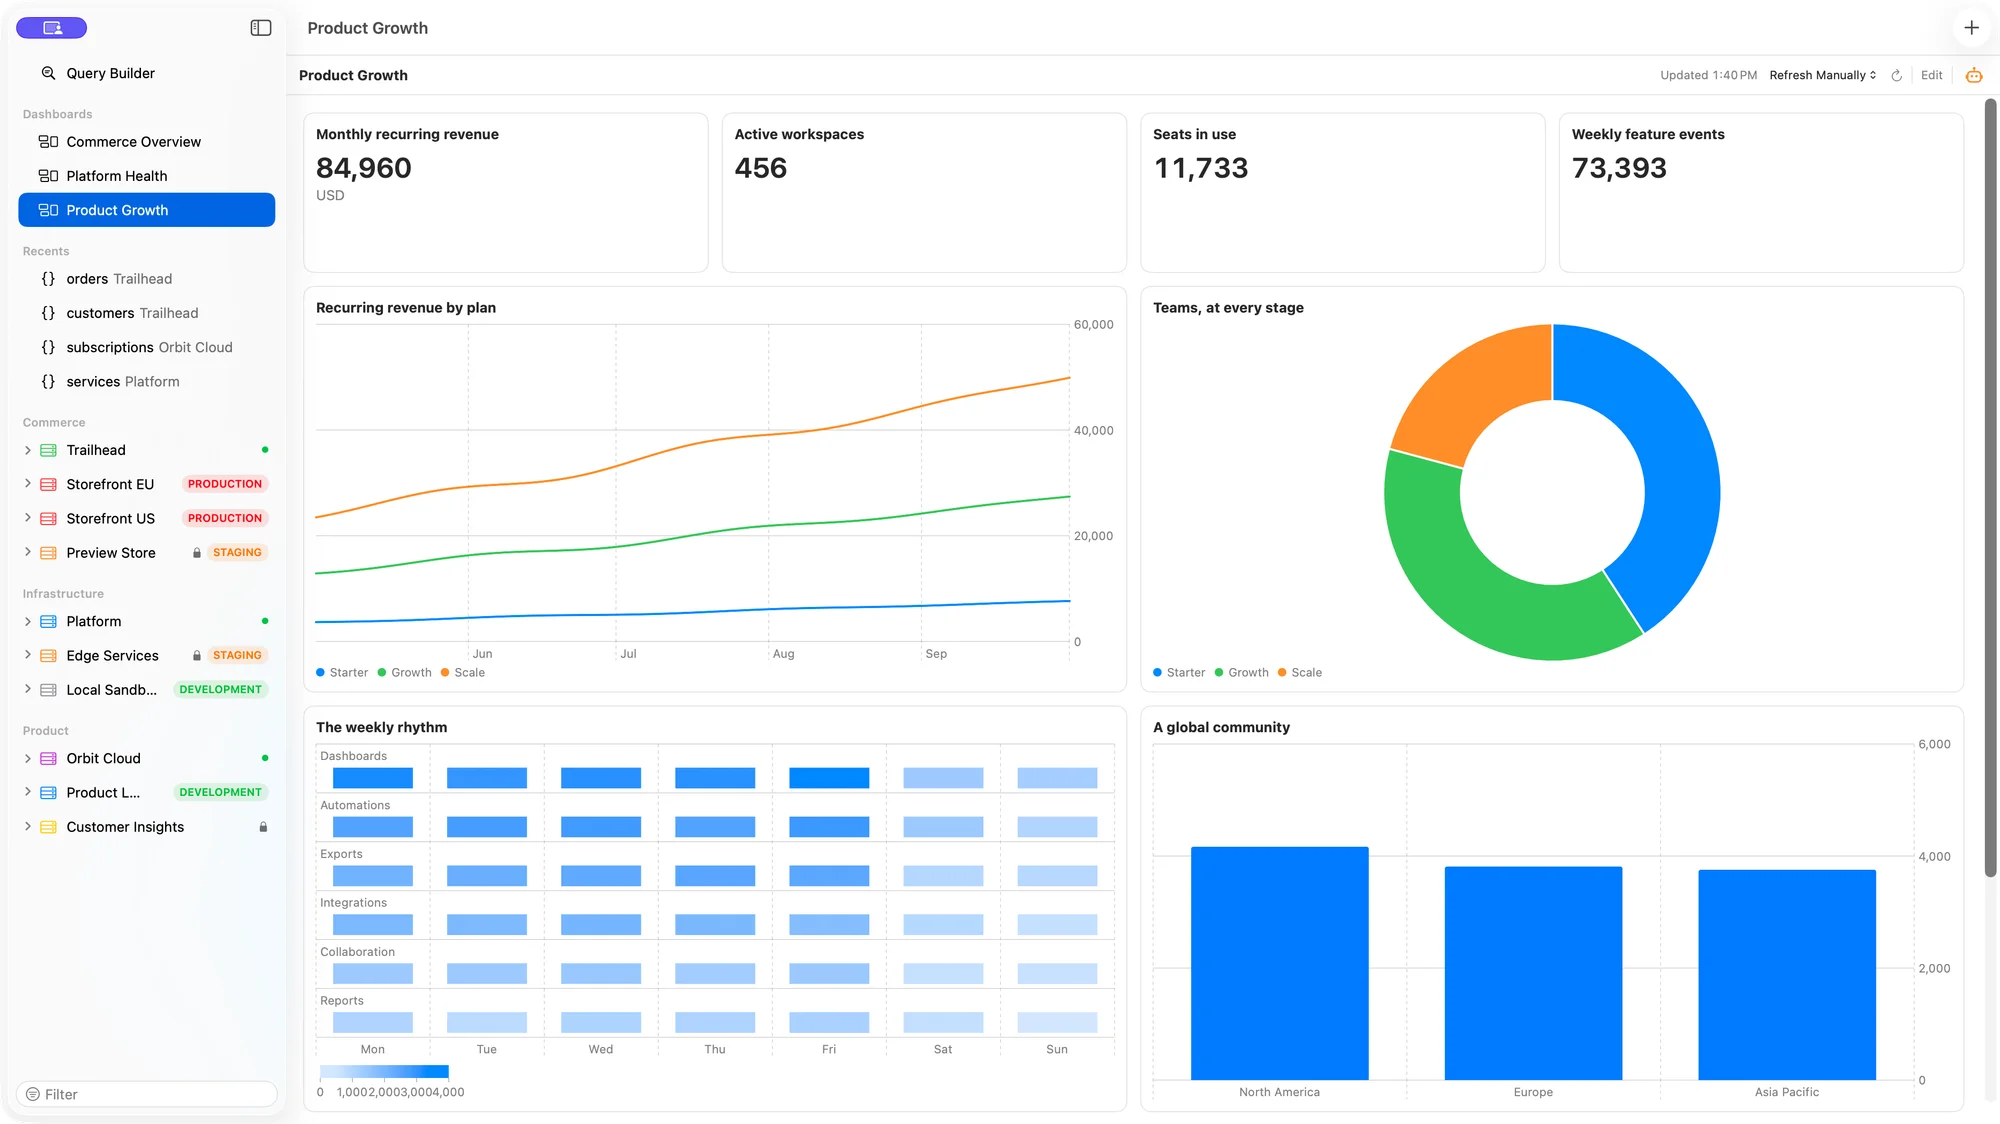
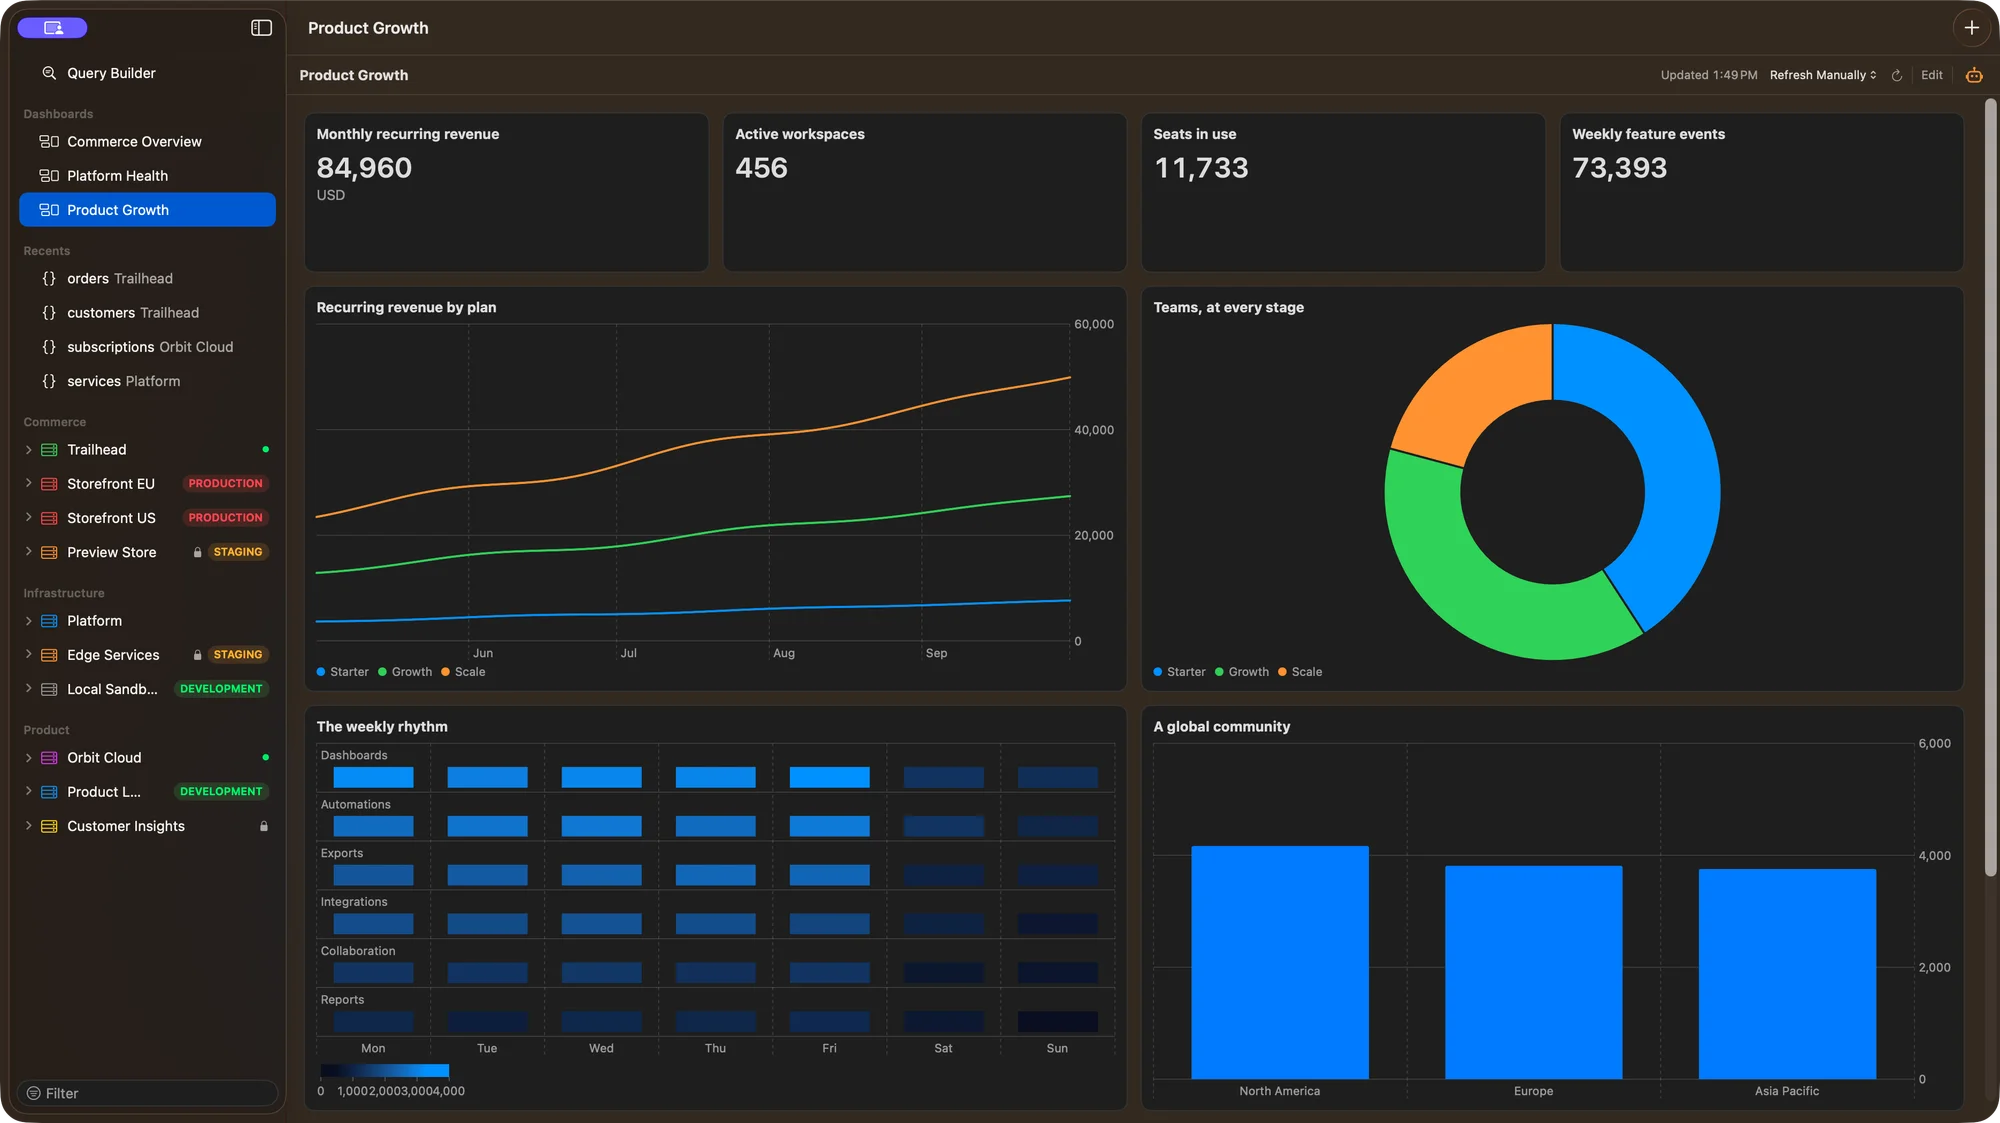
A few practical details
Dashboard queries are read-only. Write stages and server-side JavaScript are refused, and production connections require permission before widgets run.
No. It stores connection aliases, not connection credentials. Each person resolves those aliases to their own local connections.